Spurious Correlaton: A Simple Demonstration
Jun 27, 2020
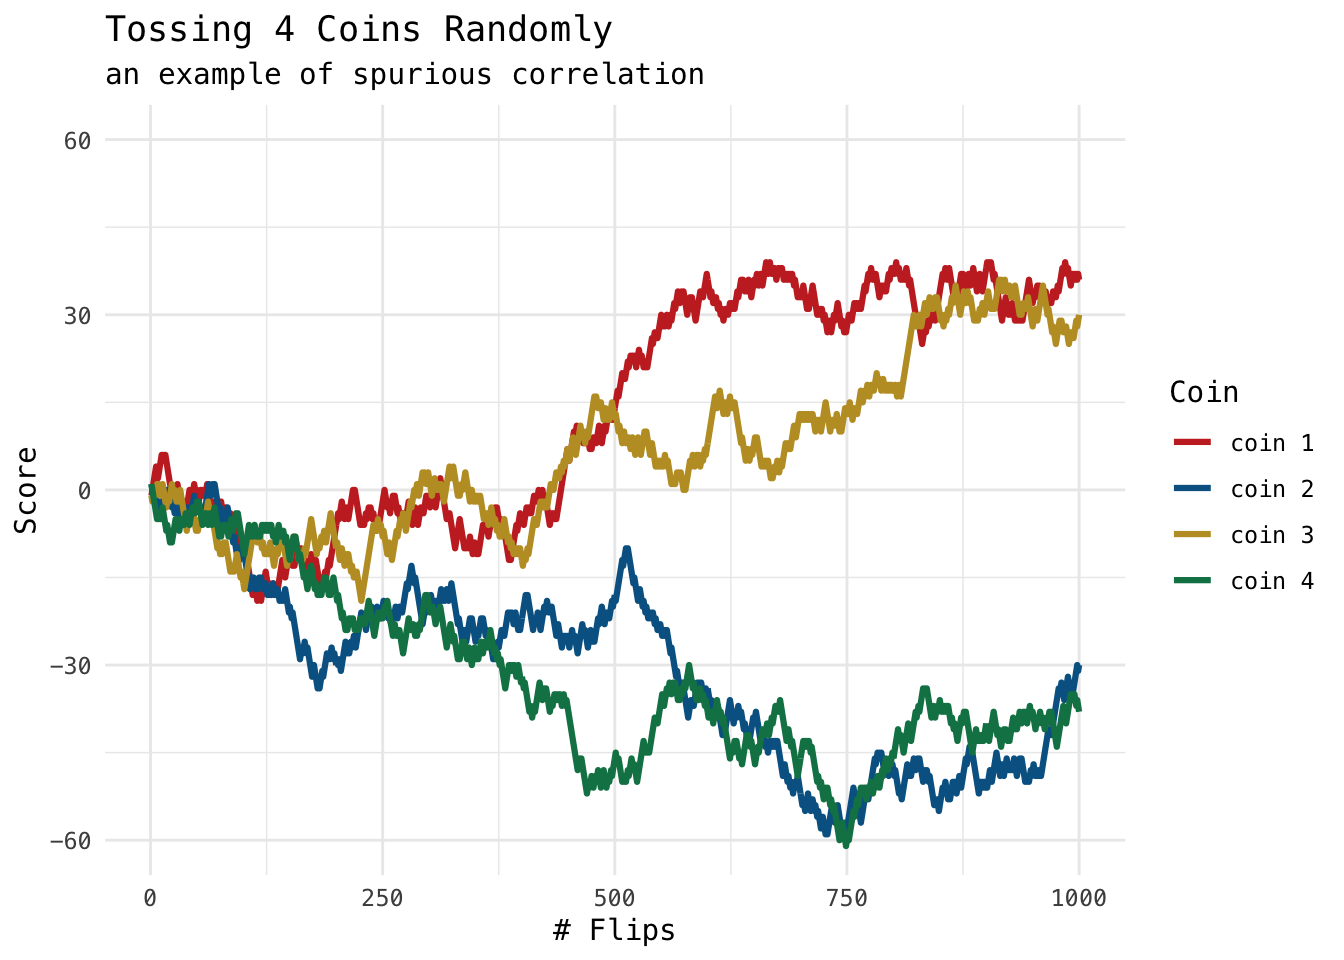
Very often, some business analyst tries to put some sequences on a line graph and determine if there is some correlation. This can be dangerously misleading. Let’s demonstrate this, we flip n coins, with head gives 1 point and tail minuses 1 point. Logically, there should not (and do not) be any correlation between them. However, merely looking at the graph may tell otherwise.
library(tidyverse)
library(ggthemes)
set.seed(1234)

coins = 4L
flips = 1e3

calc_score <- function(vec) {
    map_dbl(1:length(vec),
            ~ sum(vec[1:.x] == 1) - sum(vec[1:.x] == 0))
}

f   <- expression(rbinom(flips, 1, 0.5))

res <- rerun(coins, calc_score(eval(f))) %>%
    set_names(paste("coin", 1:coins)) %>%
    bind_rows() %>%
    mutate(flip = row_number())

df <- res %>%
    pivot_longer(cols = -flip,
                 names_to = "coin",
                 values_to = "score")

df %>%
    ggplot(aes(flip, score, col = coin)) +
    geom_line(aes(group = coin), size = 1.1) +
    coord_cartesian(ylim = c(-60, 60)) +
    scale_color_wsj() +
    theme_minimal(base_family = "Menlo") +
    labs(x = "# Flips", y = "Score", col = "Coin",
         title = "Tossing 4 Coins Randomly",
         subtitle = "an example of spurious correlation")