Funnel Visualization w/ Waffle Chart
Jun 14, 2020 #ggplot2 #datavis
First lets make some dummy data. Imagine we are running a campaign that gives away coupons to newly registered customers.
library(tidyverse)
old <- theme_set(theme_minimal(base_family = "Menlo") +
                     theme(legend.position = "top",
                           legend.spacing  = unit(10, "mm")))
pal <- c("Female" = "#fb4675",
         "Male"   = "#51c5e5")
set.seed(1212)
prop_of_x <- function(x) {
round(x * rnorm(1, mean = 0.5, sd = 0.05))
}
make_data_frame <- function(n) {
N = n
A = prop_of_x(N)
B = prop_of_x(A)
C = prop_of_x(B)
D = prop_of_x(C)
map(.x = c(A, B, C, D),
.f = ~ c(rep(1, times = .x), rep(0, times = N - .x))) %>%
set_names(c("clicks", "subscribes", "confirms", "redeems")) %>%
as_tibble()
}
df <- bind_rows(Male = make_data_frame(100),
Female = make_data_frame(100),
.id = "gender")Bar Chart
The simplest and perhaps the most effective.
df %>%
    group_by(gender) %>%
    summarise(across(everything(), list(sum = sum)), n = n()) %>%
    pivot_longer(-gender, names_to = "funnel", values_to = "val") %>%
    ggplot(aes(reorder(funnel, val), val, fill = gender)) +
    geom_col(position = "dodge", width = 0.3) +
    scale_x_discrete(labels = function(x) str_to_title(str_remove(x, "_sum$"))) +
    scale_fill_manual(values = pal) +
    guides(fill = guide_legend(reverse = TRUE)) +
    coord_flip() +
    labs(x = "", y = "", fill = "",
         title = "The Easiest Way - Bar Chart")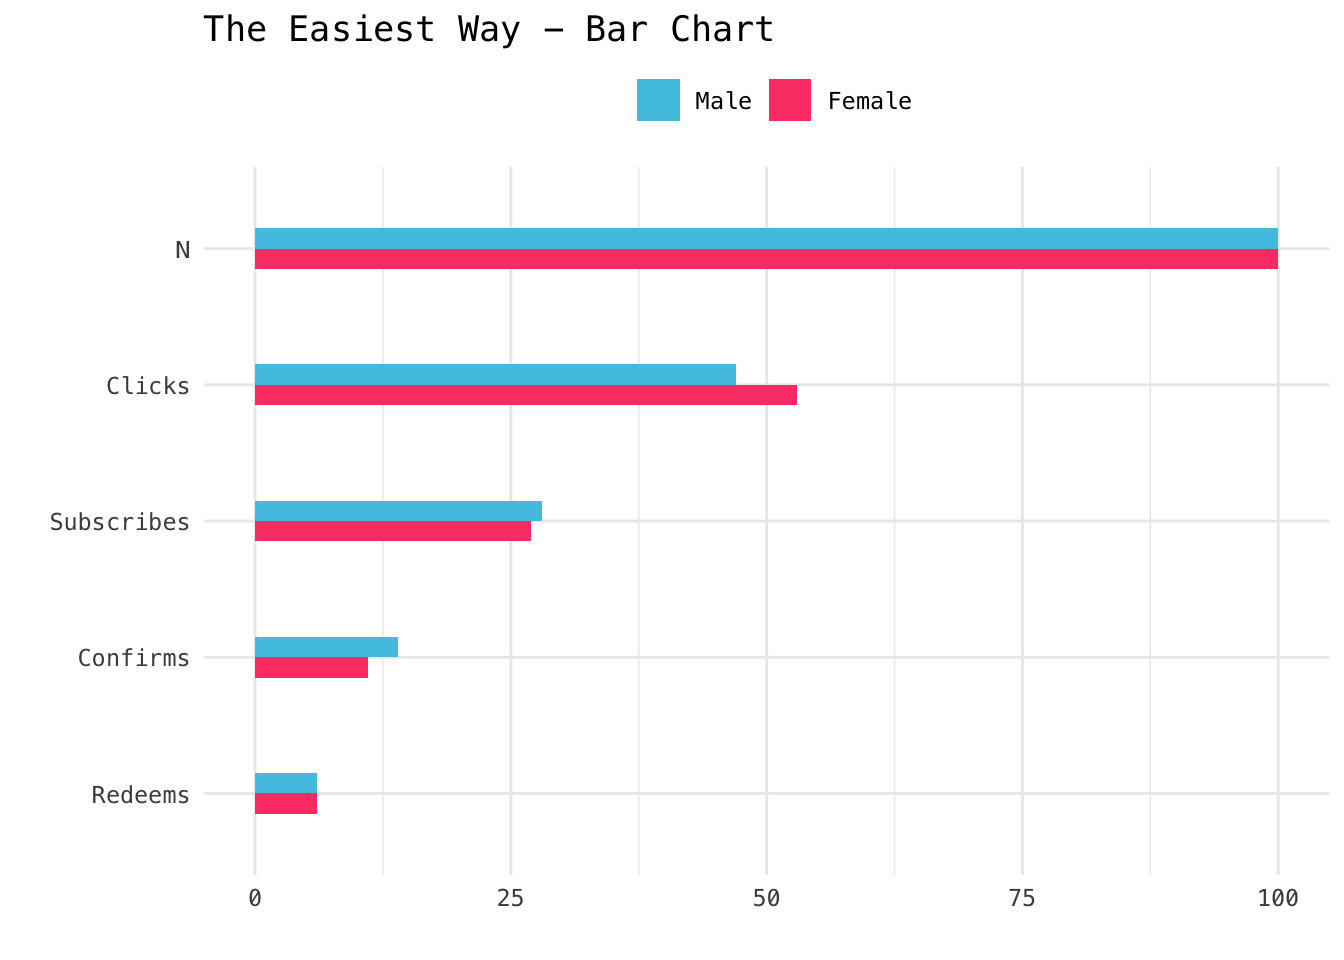
Waffle Chart
An experiment…
library(waffle)

df %>%
    group_by(gender) %>%
    summarise(across(everything(), list(sum = sum), .names = "{col}"),
              N = n(),
              .groups = "keep") %>%
    pivot_longer(
        -gender,
        names_to     = "funnel",
        values_to    = "val",
        names_ptypes = list(funnel = factor(
            levels   = c("N", "clicks", "subscribes", "confirms", "redeems"),
            ordered  = TRUE
        ))
    ) %>%
    arrange(gender, -val) %>%
    mutate(waffle_sq = val - lead(val),
           waffle_sq = if_else(is.na(waffle_sq), val, waffle_sq)) %>%
    ggplot(aes(fill = funnel, values = waffle_sq, col = gender)) +
    geom_waffle(n_rows = 10, flip = TRUE) +
    scale_color_discrete(guide = "none") +
    scale_fill_brewer(palette = "Oranges",
                      labels = function(x) str_to_title(x)) +
    coord_equal() +
    facet_wrap(~ gender) +
    theme(panel.grid = element_blank(),
          axis.ticks = element_blank(),
          axis.text  = element_blank())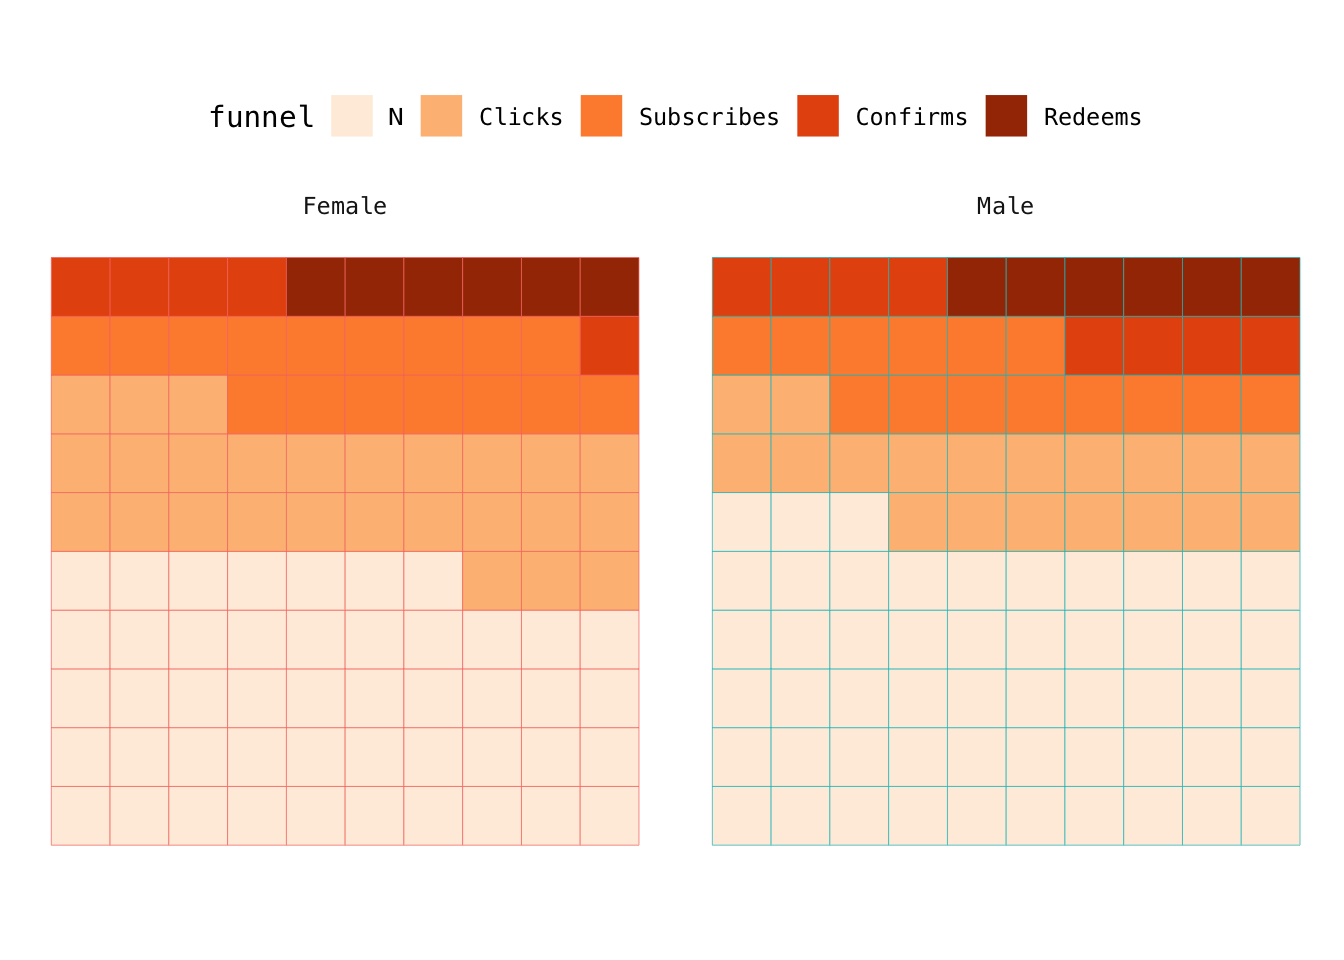
Once again, simplicity prevails.