Puzzle: In A Village Where People Only Want Boys
Feb 29, 2020 #monte-carlo #dynamic
The origin of this question is an interview question from Google.
In a village in which people only want boys every family continues to have children until they have a boy. If they have a girl, they have another child. If they have a boy, they stop. What is the expected boy to girl ratio in the village?
Though this can be solved mathematically (of course it can), the question is (IMO) easier to solve by thinking in a tree/branches structure.
If we assume the village has N families, and the probability of having a boy or girl is 50/50, then
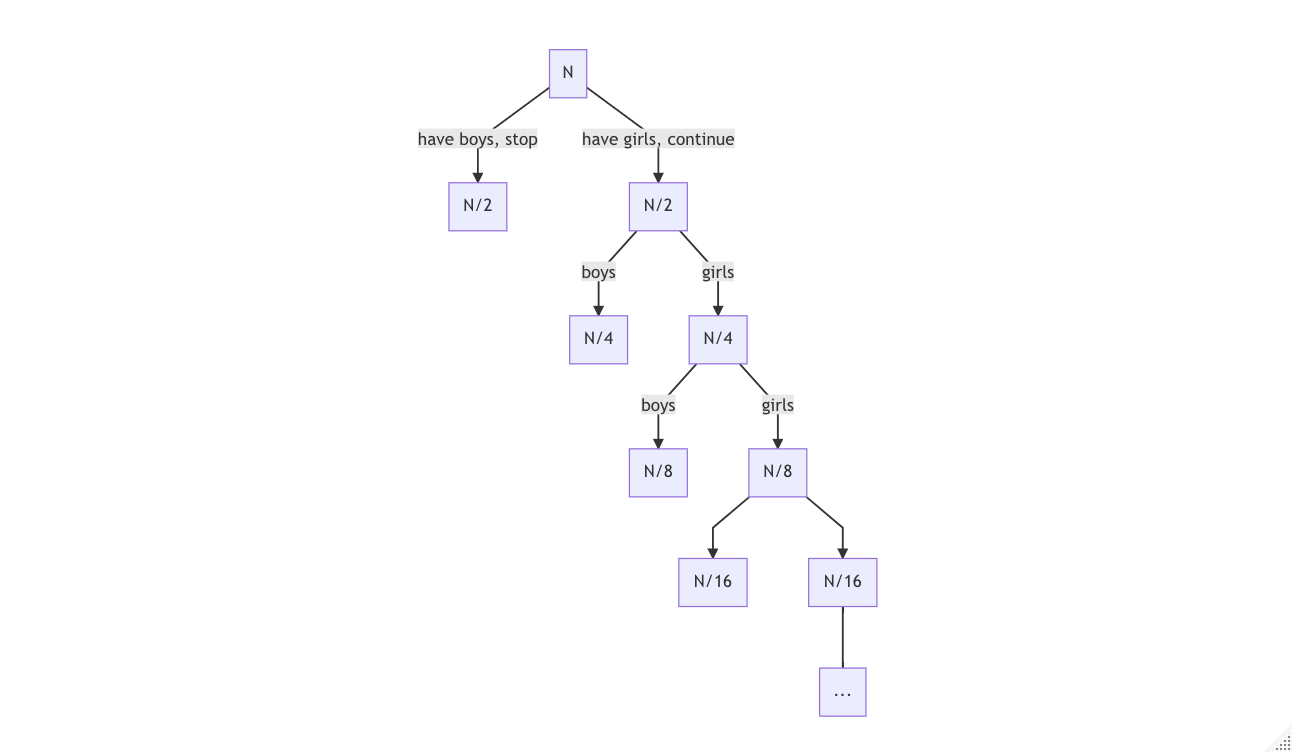
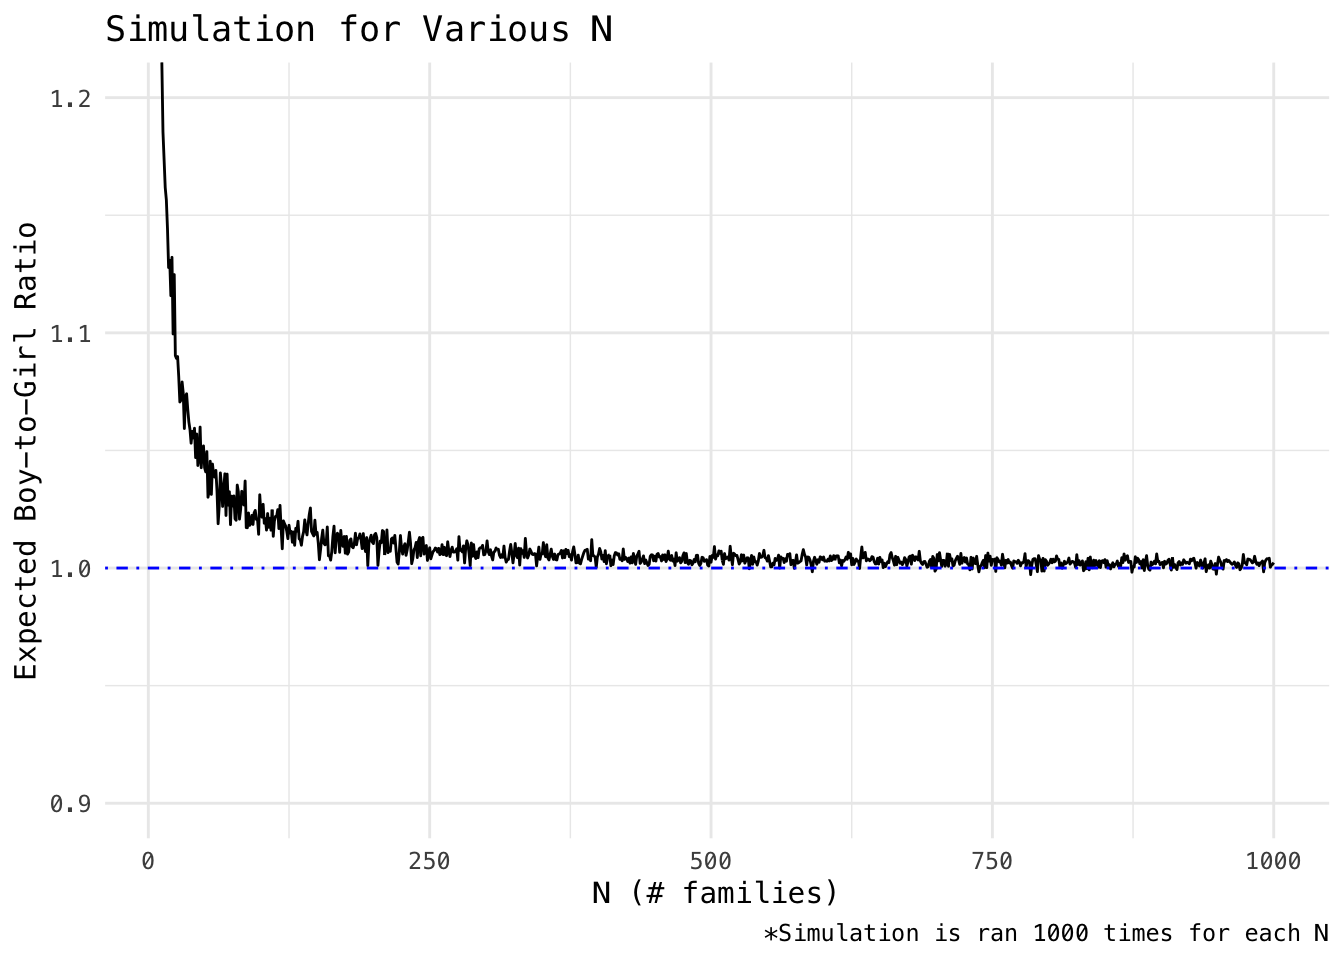
Here we see the obvious, as the depth of tree extends, the boy-to-girl disparity will ultimately become insignificant. Hence, the ratio will be very close to 50/50.
However, the question itself is not the main interest of this post. It turns out to be quite a nice practice for simulation coding. The following attaches the source code to the simulation as it validates the answer given above. I utilize both functional (higher order function) and dynamic programming here.
library(magrittr)

simulate_once <- function(N, verbose=FALSE) {

    # nobody has anything yet...
    boys  = 0; girls = 0;

    print_vars <- function() {
        message("BGR:", boys, "/", girls)
        message("==================")
    }

    tryonemore <- function(x, msgON) {
        # browser()
        if(msgON) message(x)

        # terminal condition: all 1 (boys)
        if (all(x)) {
            boys  <<- boys + sum(x)
            if (msgON) print_vars()
            return(1)
        }

        # assign to parent env so that we can keep track
        boys  <<-  boys + sum(x)
        girls <<- girls + sum(!x)

        if (msgON) print_vars()
        return(tryonemore(rbinom(sum(!x), 1, 0.5), msgON = msgON))
    }
    # init call
    tryonemore(rbinom(N, 1, 0.5), msgON=verbose)
    return(boys / girls)
}
set.seed(1111)
simulate_once(10, verbose = TRUE)
## 0010111010
## BGR:5/5
## ==================
## 01111
## BGR:9/6
## ==================
## 0
## BGR:9/7
## ==================
## 1
## BGR:10/7
## ==================
## [1] 1.428571
library(purrr)
library(ggplot2)
N.range = 11:1000
res <- map_dbl(N.range, ~ {
mean(replicate(1000, simulate_once(.x)))
})
data.frame(ind = N.range, ratio = res) %>%
ggplot(aes(ind, ratio)) +
geom_line() +
geom_hline(yintercept = 1, lty = 4, col = "blue") +
scale_y_continuous(limits = c(0.9, 1.2)) +
theme_minimal(base_family = "Menlo") +
labs(x = "N (# families)",
y = "Expected Boy-to-Girl Ratio",
caption = "*Simulation is ran 1000 times for each N",
title = "Simulation for Various N")