Programming in dplyr - Row Filtering
How do you program the row filtering dynamically when working with dplyr verb?
Say we have a dataframe with 2 columns, x and y.
library(tidyverse)
library(rlang)

# make some sample
set.seed(1234)
df <- 2 %>%
    rerun(rnorm(100, 10, 2) %>% round()) %>%
    bind_cols()
colnames(df) <- c("x", "y")

# simple plot
p <- df %>%
    ggplot(aes(x, y)) +
    geom_point(position = position_jitter(width = 1),
               alpha = 0.7) +
    theme_minimal()
p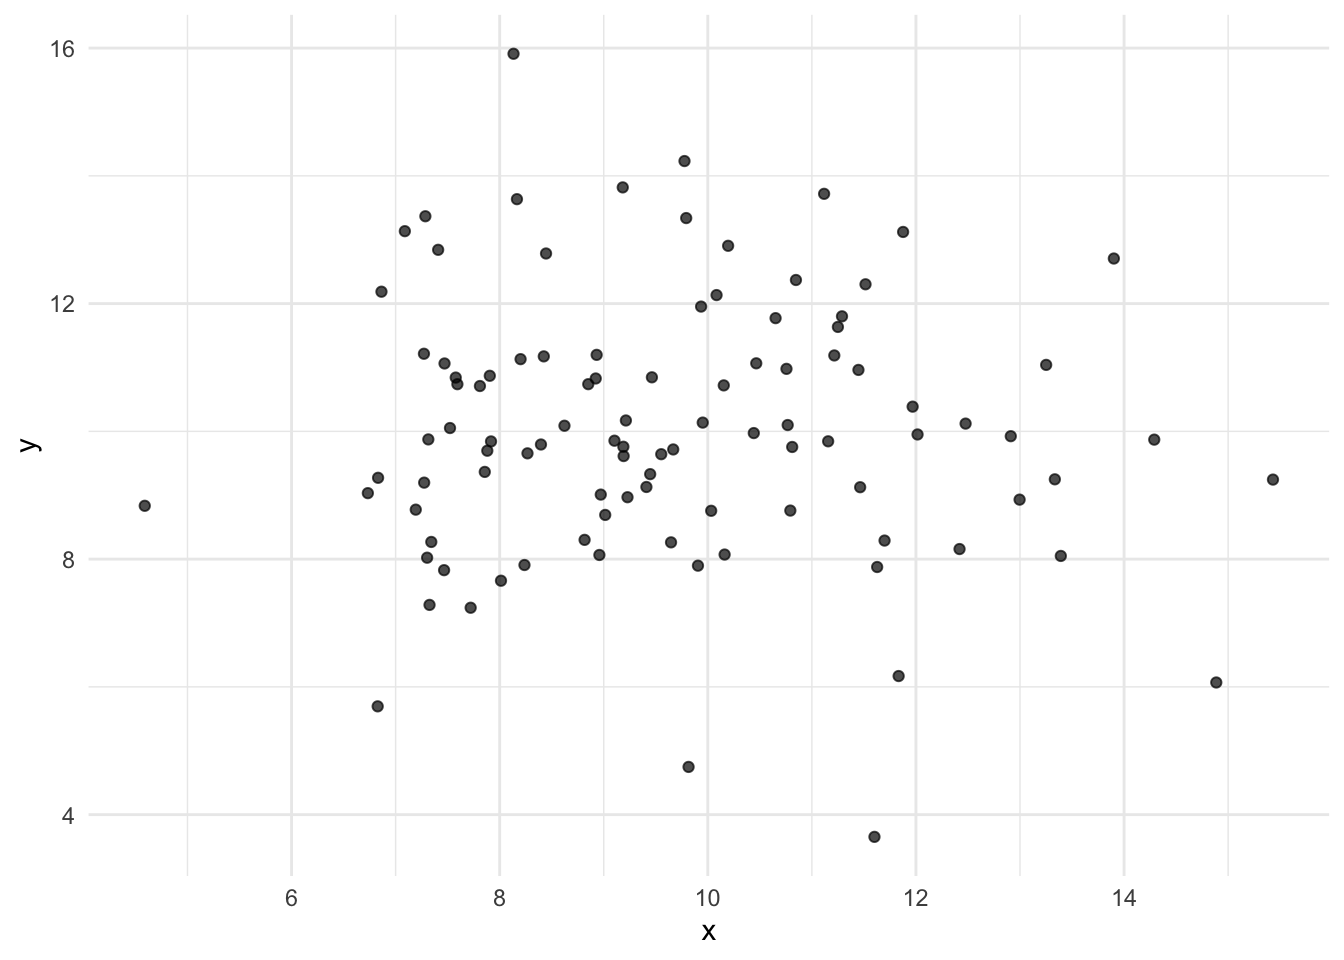
Our objective here is to ‘zone’ out the points that fall in the 50th percentile of both x and y.
summary(df)## x y
## Min. : 5.00 Min. : 4.00
## 1st Qu.: 8.00 1st Qu.: 9.00
## Median : 9.00 Median :10.00
## Mean : 9.71 Mean :10.06
## 3rd Qu.:11.00 3rd Qu.:11.00
## Max. :15.00 Max. :16.00# filter values within (w) q1, q3
(w <- df %>%
filter(x >= quantile(x, probs = 0.25),
x <= quantile(x, probs = 0.75),
y >= quantile(y, probs = 0.25),
y <= quantile(y, probs = 0.75)))## # A tibble: 42 x 2
## x y
## <dbl> <dbl>
## 1 8 11
## 2 11 9
## 3 11 10
## 4 9 10
## 5 9 11
## 6 8 10
## 7 9 10
## 8 8 9
## 9 8 10
## 10 8 11
## # … with 32 more rows# points that fall outside q1, q3
v <- anti_join(df, w, by = c("x", "y"))
# modify previous plot
w %>%
ggplot(aes(x, y)) +
geom_jitter(width = 1, col = "red") +
geom_jitter(data = v, aes(x, y), alpha = 0.7) +
theme_minimal()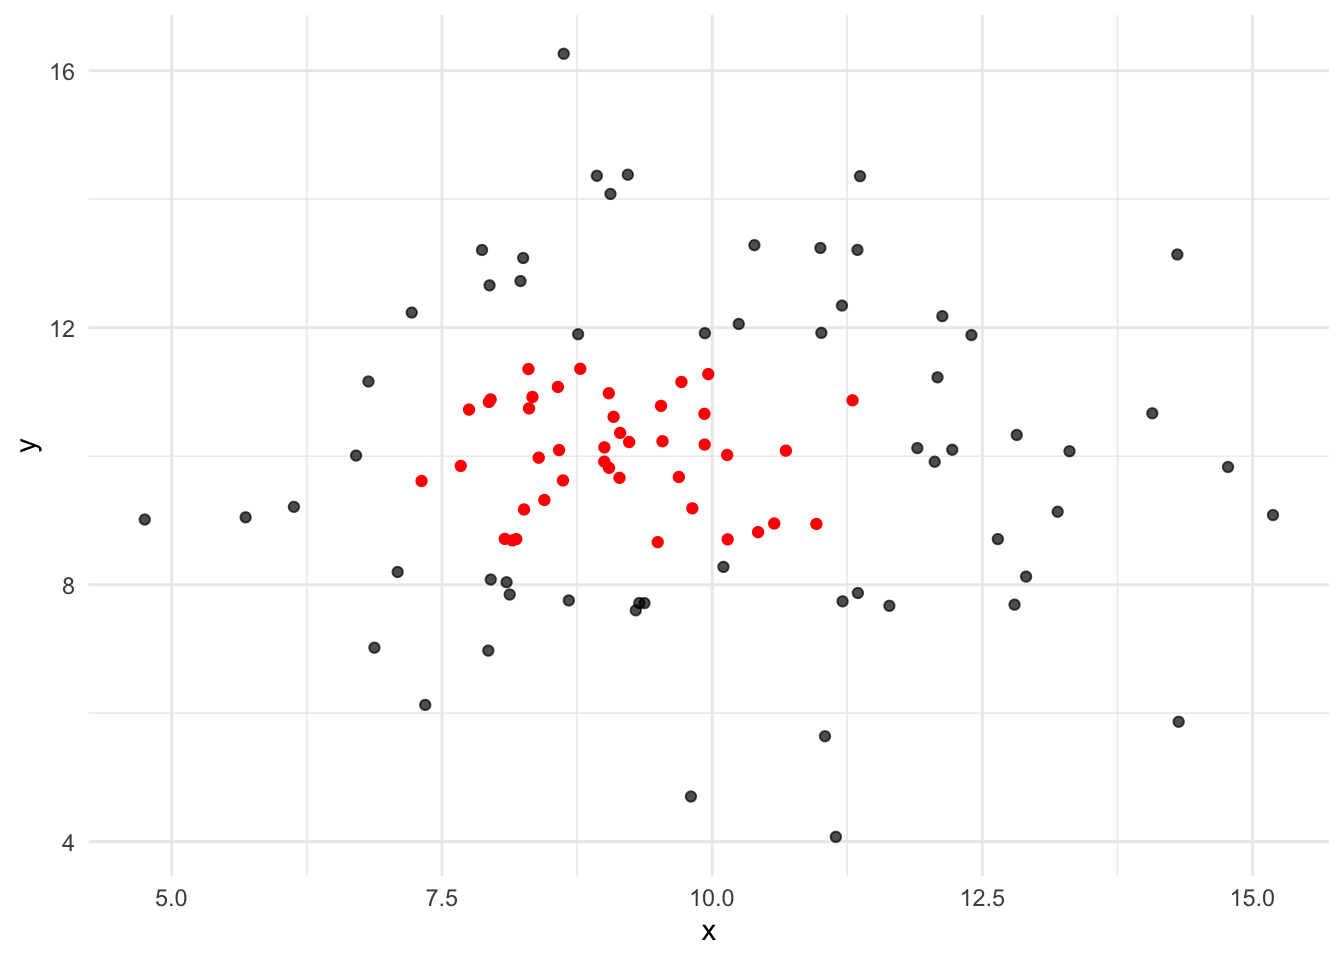
The way that we express our filtering conditions is what we aim to simplify in this post.
filter(
    data = df,
    x >= quantile(x, probs = 0.25),
    x <= quantile(x, probs = 0.75),
    y >= quantile(y, probs = 0.25),
    y <= quantile(y, probs = 0.75)
    ))
Expression
We start from forming a simple expression in literal text.
text_expression <- function(var, ops, pct) {
    sprintf("%s %s quantile(%s, probs = %g)", var, ops, var, pct)
}
text_expression("x", ">=", .75)## [1] "x >= quantile(x, probs = 0.75)"text_expression("y", "<=", .75)## [1] "y <= quantile(y, probs = 0.75)"Rlang
We use rlang to transform text into R expression.
custom_filter <- function(x, filter_expr) {
    expr <- parse_expr(filter_expr)
    df %>% filter(!!expr)
}
custom_filter(x, text_expression("x", ">=", .75))## # A tibble: 32 x 2
## x y
## <dbl> <dbl>
## 1 11 9
## 2 12 10
## 3 11 8
## 4 11 10
## 5 12 10
## 6 15 10
## 7 11 12
## 8 11 9
## 9 12 12
## 10 13 9
## # … with 22 more rowsMultiple Arguments
It takes the following steps,
- Use
purrr::mapto form multiple expressions - Use
;or\nto join formed expressions - Use
rlang::parse_exprsto transform texts into R expressions - Use
!!!(3x bang) to slice expressions
# the following has 3 expressions
parse_exprs("NULL; list()\n foo(bar)")## [[1]]
## NULL
##
## [[2]]
## list()
##
## [[3]]
## foo(bar)Let’s continue onto our example.
# form 'head' of our expressions
(ehead <- map(.x = list("x", "y"), .f = paste, list(">=", "<=")))
## [[1]]
## [1] "x >=" "x <="
##
## [[2]]
## [1] "y >=" "y <="# form 'taik' of our expressions
(etail <- map(.x = list("x", "y"),
.f = ~ sprintf('quantile(%s, probs = %g)', .x, .y),
list = c(.25, .75)))## [[1]]
## [1] "quantile(x, probs = 0.25)" "quantile(x, probs = 0.75)"
##
## [[2]]
## [1] "quantile(y, probs = 0.25)" "quantile(y, probs = 0.75)"# combine head and tail
(exprs <- map2(ehead, etail, ~ sprintf("%s %s", .x, .y)))## [[1]]
## [1] "x >= quantile(x, probs = 0.25)" "x <= quantile(x, probs = 0.75)"
##
## [[2]]
## [1] "y >= quantile(y, probs = 0.25)" "y <= quantile(y, probs = 0.75)"# collapse our expressions into a long string
(exprs <- exprs %>%
unlist() %>%
# use ';' or "\n"
paste0(collapse = ";"))## [1] "x >= quantile(x, probs = 0.25);x <= quantile(x, probs = 0.75);y >= quantile(y, probs = 0.25);y <= quantile(y, probs = 0.75)"Apply Custom Filtering
# modify our custom filtering to fit multiple expressions
custom_filter = function(x, exprs) {
    # take note of the plurar form
    exprs_list <- parse_exprs(exprs)
    # apply on data frame
    x %>% filter(!!!exprs_list)
}
# thats it
(w2 <- df %>% custom_filter(exprs))## # A tibble: 42 x 2
## x y
## <dbl> <dbl>
## 1 8 11
## 2 11 9
## 3 11 10
## 4 9 10
## 5 9 11
## 6 8 10
## 7 9 10
## 8 8 9
## 9 8 10
## 10 8 11
## # … with 32 more rowsw2 %>%
ggplot(aes(x, y)) +
geom_point(position = position_jitter(width = 1), col = "red") +
geom_point(data = anti_join(df, w), aes(x, y)) +
theme_minimal()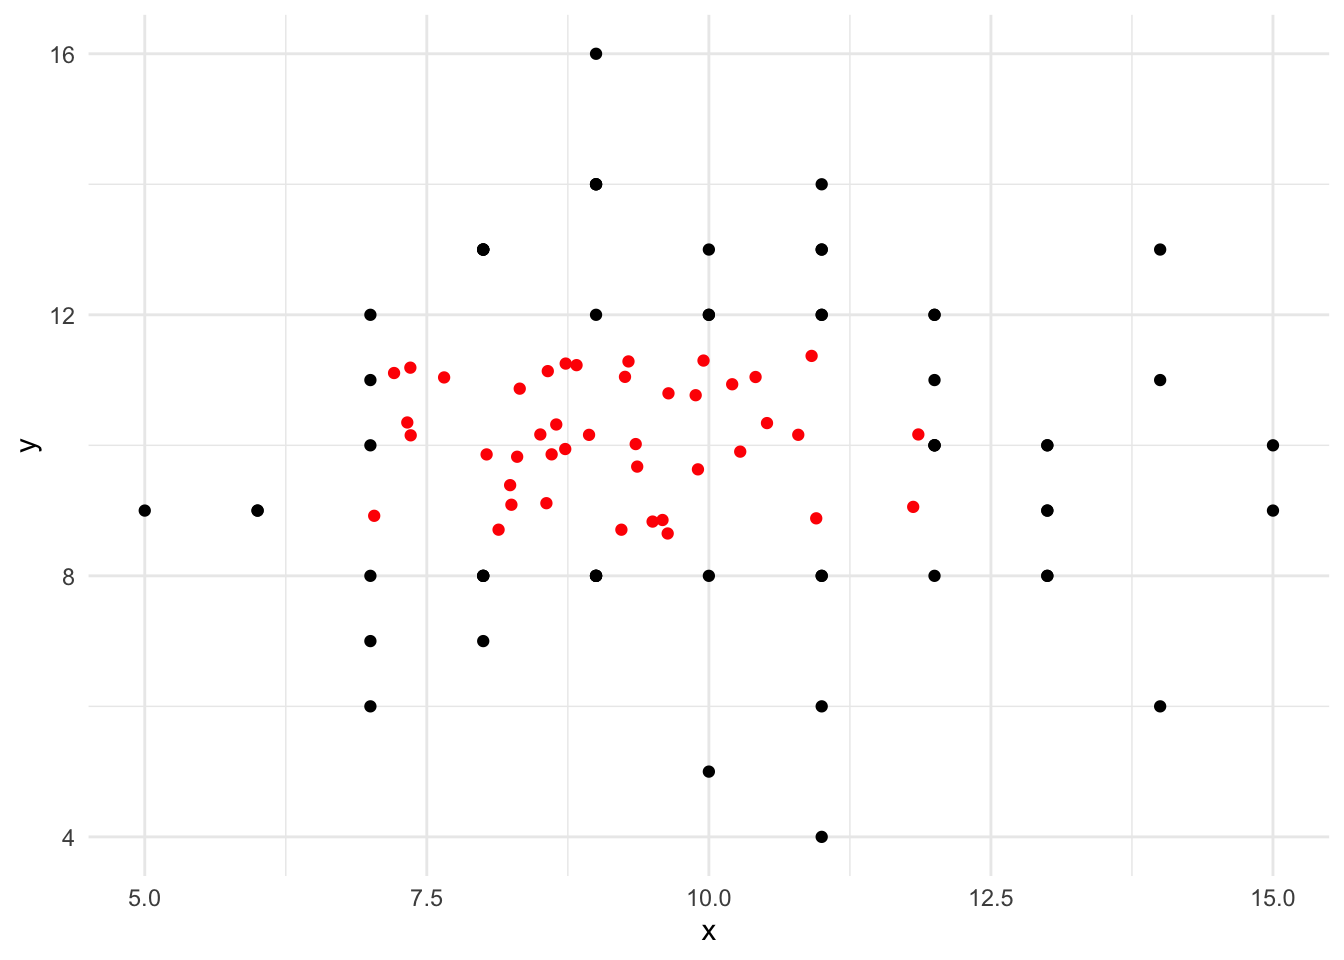
# final check
all(w == w2)## [1] TRUE