Dixon Q-Test
Jun 25, 2018 #outliers
library(dplyr)
library(outliers)

set.seed(5678)

get_case <- function(which_case = c("one", "two")){

    # generate data from a normal distribution
    dat <- rnorm(n = 10, mean = 1000, sd = 100) %>% round()
    switch(which_case,
           # add outlier on the left
           "one" = c(dat, round(mean(dat) - sd(dat) * 3.5) ),
           # add outlier on the right
           "two" = c(dat, round(sd(dat) * 3.5 + mean(dat)) )
    )
}
Case One: Test Mininum Value by Default ———————————
vecs <- get_case("one")
plot(rep(1,length(vecs)), vecs)
boxplot(vecs, add = TRUE)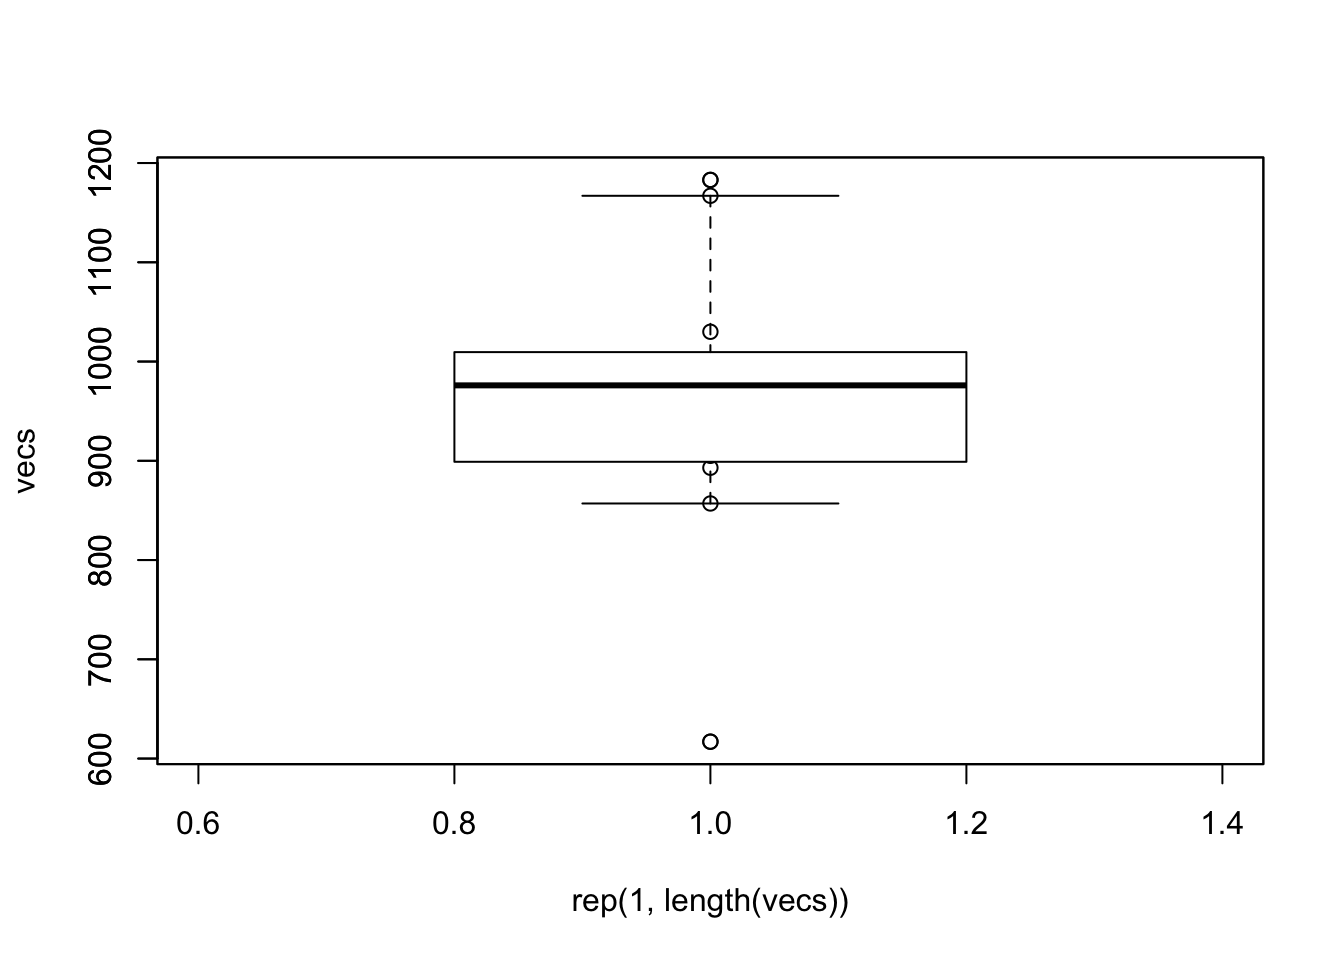
dixon.test(vecs)##
## Dixon test for outliers
##
## data: vecs
## Q = 0.50182, p-value = 0.2329
## alternative hypothesis: lowest value 617 is an outlierdixon.test(vecs, opposite = TRUE)##
## Dixon test for outliers
##
## data: vecs
## Q = 0.46933, p-value = 0.3157
## alternative hypothesis: highest value 1183 is an outlierCase One: Test Maximum Value by Default ———————————
vecs <- get_case("two")
plot(rep(1,length(vecs)), vecs)
boxplot(vecs, add = TRUE)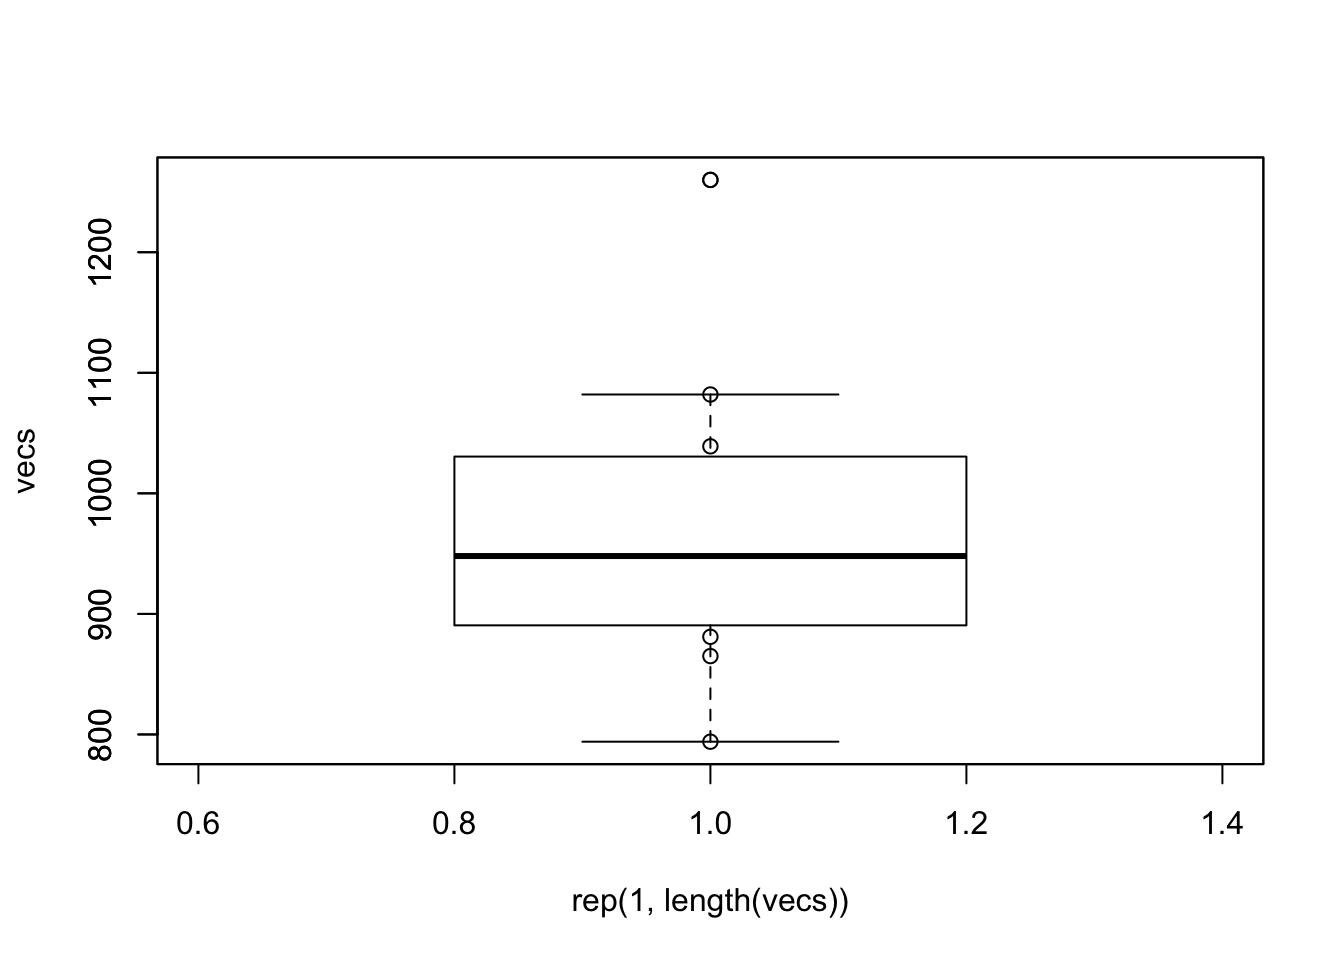
dixon.test(vecs)##
## Dixon test for outliers
##
## data: vecs
## Q = 0.55949, p-value = 0.1233
## alternative hypothesis: highest value 1260 is an outlierdixon.test(vecs, opposite = TRUE)##
## Dixon test for outliers
##
## data: vecs
## Q = 0.30208, p-value = 0.9855
## alternative hypothesis: lowest value 794 is an outlier